
Format Log Columns
To access this screen:
- Display the Log View Properties screen and select the Columns tab.
Define downhole columns that sit alongside either strip log information or a loaded drillhole object.
This screen differs from the Format Downhole screen in that this log sheet-specific instance contains a list of attributes that can be used to define log sheet formatting, whereas in the 3D window equivalent, an attribute is selected from a static or dynamic drillhole object beforehand. Otherwise the functionality is very similar.
Note: The other difference is that a log sheet can only display information for a dynamic drillhole, whereas the Format Downhole screen can be used to configure formatting for both static and dynamic drillhole types.
Formatting Styles
The following display styles are available for 3D downhole columns. Access them via the Style menu at the top of the Format Downhole Column screen:
|
Style |
Description |
Example |
More Information |
Property Help |
|
Text |
Textual attribute values (numeric or alphanumeric, displayed down the hole). |
|
||
|
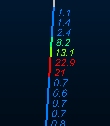
Bars with Annotation |
Coloured (filled) bars and text overlay |
|
|
|
|
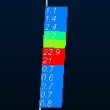
Bars |
Coloured (filled) bars |
|
|
|
|
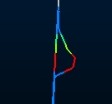
Braces with Annotation |
Text annotation with brace style connector. |
|
|
|
|
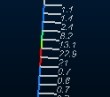
Ticks with Annotation |
Text annotation with tick style connector.
|
|
|
|
|
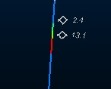
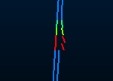
Arrows with Annotation |
Text annotation with arrows style connector.
|
|
|
|
|
Line Graph |
Unfilled line graph for Text annotation with brace style connector. values |
|
|
|
|
Histogram |
Unfilled histogram for numeric values |
|
|
|
|
Filled Histogram |
Filled histogram for numeric values |
|
|
|
|
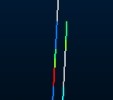
Trace |
Show parallel trace using any attribute legend or color |
|
|
|
|
Angles |
Show numeric values as angles (higher numbers show more severe angle deviation from hole) |
|
|
|
|
External Image File |
Show predefined images per hole or interval alongside the sample |
|
|
Image * |
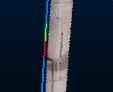
* See Adding Images to your Drillhole Display for instructions on how to configure downhole images for loaded drillhole data.
Format Log Columns
-
Display the Columns screen.
-
Using the Columns in View list, select an attribute to format.
-
Format the column using one of the available options:
-
Up/Down – Adjust the position of the highlighted column in the Columns in View list (see above). If your data column is set to Overlap previous column, it will always overlap the column immediately above it in the list. Columns are drawn in a left-right order on the sheet (corresponding to up-down in the Columns in View list) so reordering here can be used to change the position of the log column on the sheet.
-
Delete – Remove the column selected in the Columns in View list.
-
Add – Add a new column to the log sheet, using the Column Wizard.
-
Copy – Add a copy of the selected column. Each copy is added to the bottom of the Columns in View list, but can be reordered (see above).
-
Rename – Rename a log sheet column. If the Column Names Row is used in log sheet formatting (for example, the title), the column width is automatically adjust to accommodate it
-
Reset – Reset the log sheet to show only the default columns.
-
Font – Use the Font screen to set the font style.
-
Related topics and activities: